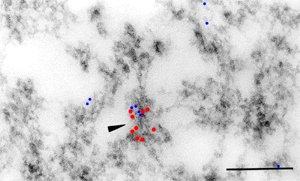
Introduction and Examples- Clustering and Colocalization- Structure Mapping Clustering and ColocalizationImmunogold labeling is a specific and sensitive tool for detection of various antigens in biological samples. Usually, the immunogold detection is performed on ultrathin sections less than 100 nm thick. When a given cell structure contains a marker protein, immunogold labelling can be used for delineating this structure by observing spatial variations in labelling density. In a more complicated system, double immunogold labeling using gold particles of two sizes can be used for an assessment of spatial relationships, colocalization or mutual inhibition (exclusion) of two kinds of structures. Unfortunately, appropriate statistical or stereological tools that would allow a biologist to test a significance of the observed patterns (clustering or colocalization, in particular) are missing. The program therefore is a suitable method for quantitative analysis of single or multiple immunogold labelling patterns.Methods using the distribution of interpoint distances (Ripley, 1980) can be used for testing randomness of spatial patterns of one kind of label and the deviations of the spatial distribution of points from randomness: local increase (clustering) or local decrease (inhibition) in density of the label (e.g. in single immunogold labelling experiments). These methods can be also used for testing the independence of two types of labels and its deviation from independence: colocalization or mutual inhibition of the labels (e.g. in double immunogold labelling experiments). A clustering causes then a relative increase, while the inhibition causes a relative decrease in the number of shorter interpoint distances when compared with totally random process. Similarly, colocalization causes a relative increase, while the inhibition causes a relative decrease in the number of shorter interpoint distances with respect to mutually independent processes. In other words, a clustering causes an increase of the density of labels of one type in the vicinity of a typical label of the same type. Colocalization of two types of labels causes an increase of the density of labels of one type in the vicinity of a typical label of the other type. In order to analyze such spatial relationships of events, the spatial statistics uses functions characterizing the density of events (i.e. particles) as a function of the distance from a typical event (Ripley, 1980; Stoyan et al., 1995). For the analysis of clusters of particles of the same type, the pair-correlation function (PCF) and the second reduced moment function (K function) was evaluated. In order to analyse the colocalization of particles, the pair cross- correlation function (PCCF) and the second reduced moment (or cross-K) function are used. In order to prove that the observed deviations from total randomness are significant, values of confidence intervals of the two functions were calculated by method based on the Monte Carlo simulations (for more details see Theoretical Background). Sometimes, depending on the type of immunogold technique used, there is more than one gold particle per labelled site, which may be erroneously detected as clustering of particles. On the other hand, in some cases the size of immunoglobulin molecules prevents from simultaneous detection of extremely close labelling sites that can result in short range regularity or inhibition of particles (Glasbey and Roberts, 1997). Such specific properties of the immunogold labelling require modifications of methods using interpoint distances. We modified them by an artificial censoring of short distances at which the effects mentioned above prevail. As a biological model (for more details see the paper) we have used DNA replication that takes place in cell nuclei in foci scattered throughout the nucleoplasm (Nakamura et al., 1986, Nakayasu and Berezney, 1989, Hozák et al., 1993). Immunogold labelling patterns of nascent DNA and that of several nuclear proteins with known functions were investigated in replicating foci of synchronised mid S-phase HeLa cells. The results proved that the described method can be generally used as a powerful tool in biological investigations requiring statistical analysis of immunogold clustering or colocalization patterns. Detection of clustering Example of clustering of antigen A labeled with 10 nm gold particles (red dots, arrowhead). Clustering occurs in the interval of 20 - 175 nm (see the histogram). It is obvious that the clustering is highly significant as the PCCF reaches values well - above one (that corresponds to a random process). Bar = 200 nm. 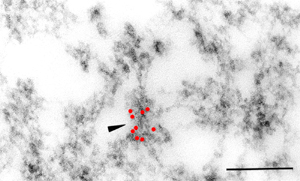  1. Example of strong colocalization of antigen A (10 nm gold particles - red dots) and antigen B (5 nm gold particles - blue dots). Clusters of both antigens are frequently intermingled (arrowhead). Both antigens strongly colocalize in the interval of 20 - 175 nm; the PCCF function reaches values well above 1 (see the histogram). Bar = 200 nm. 2. Example of a weak but significant colocalization of antigen A (10 nm gold particles - red dots) and antigen C (5 nm gold particles - blue dots). Colocalization of antigens is not obvious by visual inspection, however they colocalize in the interval of 20 - 75 nm (see the histogram). Bar = 200 nm.   Bar = 200 nm. 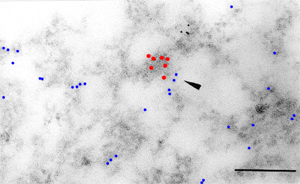  Glasbey, C. A., and Roberts, I. M. (1997) Statistical analysis of the distribution of gold particles over antigen sites after immunogold labelling. J. Microsc. 186, 258-262. Hozak, P., Hassan, A. B., Jackson, D. A., and Cook, P. R. (1993) Visualization of replication factories attached to a nucleoskeleton. Cell 73, 361-373. Nakamura, H., Morita, T., and Sato, C. (1986) Structural organization of replicon domains during DNA synthetic phase in the mammalian nucleus. Exp. Cell Res. 165, 291-297. Nakayasu, H., and Berezney, R. (1989) Mapping replication sites in the eucaryotic cell nucleus. J. Cell Biol. 108, 1-11. Ripley, B. D. (1980) Spatial statistics. John Wiley & Sons, New York, Chichester, Brisbane, Toronto Stoyan, D., Kendall, W. S., and Mecke, J. (1995) Stochastic geometry and its applications. John Wiley & Sons, Chichester, New York, Brisbane, Toronto, Singapore Structure MappingElectron microscopy (EM) is the method of choice to study subcellular compartments in biological samples with high resolution. Subcellular compartments are functional domains designated to fulfill a defined set of processes in cells. In some cases, they can be classified based on their characteristic ultrastructural appearance alone. Typically, such compartments are in the cytoplasm where they are outlined by their membranes. However, in many cases, the cellular compartments are defined by the content of specific molecules or by a presence of specific functions and they are morphologically inconspicuous in EM preparations. Such compartments can be detected using antibodies with attached label, usually gold particles. The method of immunogold electron microscopy is a very sensitive and specific tool as typically one immunogold particle detects one target molecule in a cell/tissue section. A cluster of immunogold particles can therefore be used for identification of cellular compartments even if the compartment is morphologically undistinguishable. For this purpose, it is necessary to delineate the borders of the immunogold clusters in order to define the topology of the compartment. However, the labeling has a point pattern, while a compartment is a coherent area. In addition, some background labeling is always present which complicates identification of the labeled compartments. Stereological image analysis is therefore required to interpret the density distribution of gold particles. For this, new algorithms in analogy to gray value smoothing and thresholding in light microscopy images need to be developed. Here we present a stereological method that enables to define cellular compartments based on delineating the borders of gold particle clusters, and demonstrate some examples of the practical use of the method using biological experimental data. New computer program plug-ins were developed to facilitate the practical use of this stereological method.First, we tested the method by detection of molecules which have a known distribution in cell nuclei and which can be correlated with a morphologically clearly detectable compartment. We detected ribosomal RNA (rRNA), which is produced and stored in the nucleolus – morphologically the most prominent nuclear structure. rRNA is therefore particularly well suited to mark the outline of nucleoli. In the following picture, one can see an EM view of a thin section through a human HeLa cell after detection rRNA molecules by EMISH. The label is mostly located in the nucleolus (nl). Some label is also located in ribosomes in the cytoplasm (c), and a few sites are labeled in the nucleoplasm (n) especially close to the nuclear envelope (arrows).      In a next step, the method was applied to sections of cells where nucleic acids with specific sequences were localized using in situ hybridization at the EM level (EMISH) followed by immunogold detection. In the following picture there is an EM view of a thin section through a cell after detection of chromosome 15 by EMISH and after processing the image with the plug-ins Topo-Detect, Topo-SelectPoints and Topo-Intensity. Chromosomal territory is well distinguishable attached to the nucleolus:   These two examples show that the new stereological/image analysis method is well able to discriminate cellular compartments based on density of immunogold particles. |