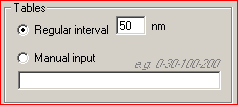
Running the Program1. Run the program from the Start menu. The following main dialog window appears: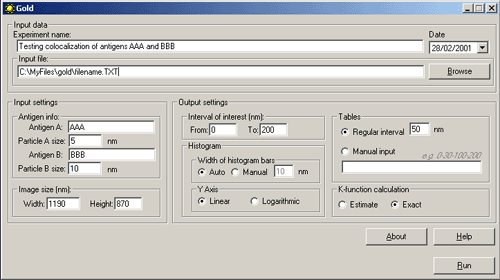   Class Class reflects the type of gold particles, e.g. Class 1 - 5 nm gold particles, Class 2 - 10 nm gold particles. Maximum two classes are allowed. Columns in the table must be [Tab]-separated X - the value of the abscissa Y - the value of the ordinate File - the file name of the source image. XY coordinates of gold particles should be presented in MICROMETERS. Usually, the size of the window using standard magnification for immunogold visualization does not exceed 10*10 micrometers. In case that the input file contains coordinates larger than 10 micrometers, the program believes that you are incorrectly entering sizes in nanometers and displays a warning message: “The coordinates of gold particles in the input file seem to be in nanometers. Program expects coordinates in micrometers. Do you want to convert values from nanometers to micrometers?" Choose “Yes” if the coordinates in your input file really are in nanometers. Choose “No” if the coordinates in your input file are correctly in micrometers. Before clicking “No” check values that you have inputted into the section “Image size” of the main program window. Remember that they must be in nanometers. Choose “Cancel” if you want to return to the main dialog window. 3. In the section "Input settings" - input the names of labeled antigens and the sizes of gold particles, which were used to label these antigens in the ultrathin sections: 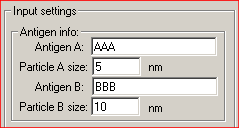   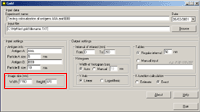 - input the interval of distances between gold particles, which is of interest for you.  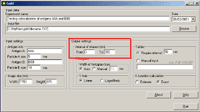  
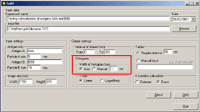  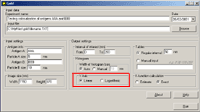  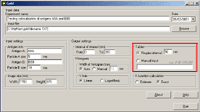 6. In the section "K-function calculation" mark the Estimate option to obtain the preliminary result (takes shorter time) or the Exact option to obtain the final result:  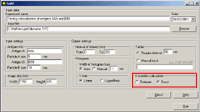 8. The output file will be created automatically in Excel (download an example) Practical recommendations- the limit of the interval of interest should be less then the shorter side of the window.- the pair correlation and cross-correlation functions should be used for exploratory analysis; in other words, these functions presented in histograms inform the user if there is any clustering or colocalization, and at what distances. As a consequence, the user can estimate the upper limit of the interval of interest for K and K  functions (respectively, d in histograms). This should prevent one from an omission of clustering or colocalization at shorter distances.
- the interactions of gold particles, antibodies and the antigen can vary at very short distances depending on antibody type, gold particles size, direct or indirect immunogold labelling, etc. The user should consider therefore very carefully the interpretation of results at distances shorter than 30 nm. Furthermore, the method is not appropriate for detection of clustering or colocalization for distances shorter than the maximal size of the immunogold, i.e. about 15 nm for 5 nm gold particles, and about 25 nm for 10 nm gold particles. - the densities of gold labeling used for testing the method (about 20 – 100 gold particles per square micron) appear to be entirely sufficient for the efficient detection of clustering or colocalization patterns. Much lower densities can be also used, however, this needs to be compensated by higher number of evaluated windows. However it should be noted that higher densities always give more significant results than very low densities compensated by higher number of evaluated windows.  |